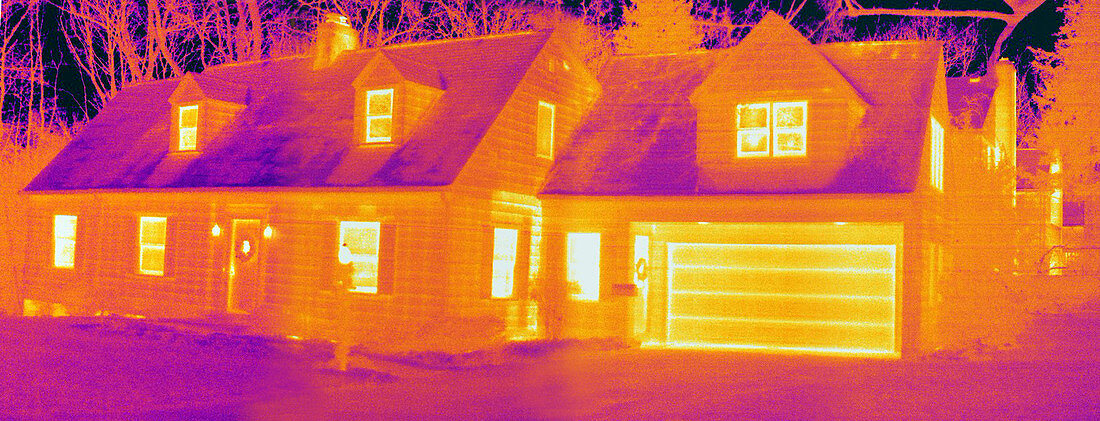
Thermogram of a House
Bildnummer 12027157

| Thermogram of a house in winter. The different colours represent different temperatures. The lightest colours are the hottest temperatures,while the darker colours represent cooler temperatures. Thermography uses special cameras that can detect light in the far-infrared range of the electromagnetic spectrum (900-14,000 nanometres or 0.9-14 m) to create an image that represents an objects temperature | |
| Lizenzart: | Lizenzpflichtig |
| Credit: | Science Photo Library / Kinsman, Ted |
| Bildgröße: | 7830 px × 3000 px |
| Modell-Rechte: | nicht erforderlich |
| Eigentums-Rechte: | nicht erforderlich |
| Restrictions: |
|
Preise für dieses Bild ab 15 €
Universitäten & Organisationen
(Informationsmaterial Digital, Informationsmaterial Print, Lehrmaterial Digital etc.)
ab 15 €
Redaktionell
(Bücher, Bücher: Sach- und Fachliteratur, Digitale Medien (redaktionell) etc.)
ab 30 €
Werbung
(Anzeigen, Aussenwerbung, Digitale Medien, Fernsehwerbung, Karten, Werbemittel, Zeitschriften etc.)
ab 55 €
Handelsprodukte
(bedruckte Textilie, Kalender, Postkarte, Grußkarte, Verpackung etc.)
ab 75 €
Pauschalpreise
Rechtepakete für die unbeschränkte Bildnutzung in Print oder Online
ab 495 €
