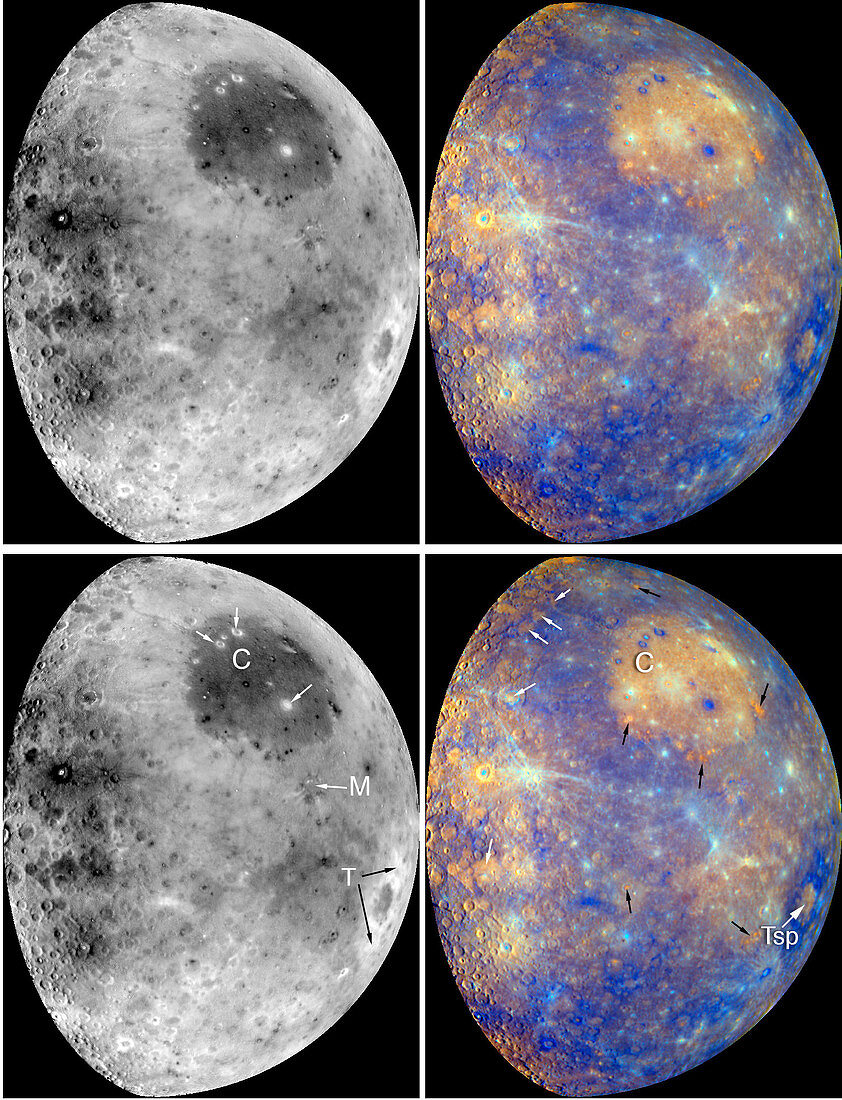
Messenger image of Mercury
Bildnummer 12005919

| These two images illustrate the power of using MESSENGER's WAC multi-spectral images to study compositional variations across the surface of Mercury. Both images shown here were generated using a statistical method known as principal component analysis. In this analysis,images taken through the WAC's 11 different narrow-band color filters are compared and contrasted to discover significant variations. The image on the left shows Mercury in one of the resulting principal components that enhances the largest color differences on Mercury's surface. The Caloris basin (labeled with a C) is shown to be considerably different from the surrounding areas in this view. Dark craters within Caloris (shown with white arrows),such as Atget crater,are clearly distinct. Mozart crater (labeled with an M) and the Tolstoj basin and material ejected from it (basin labeled with Tsp; ejecta labeled with a T) also show significant color signatures. The image on the right was created by displaying the negative of the left image in red,a different principal component in green,and a ratio of images taken in two WAC filters (430 nm/560 nm) in blue. The white arrows identify areas of Mercury's surface that are interpreted to be relatively young volcanic plains,and the black arrows point to reddish areas interpreted to be volcanoes. Most of the color differences studied here are believed to indicate variations in the mineral composition and physical state of the rocks at different places on Mercury | |
| Lizenzart: | Lizenzpflichtig |
| Credit: | Science Photo Library / NASA |
| Bildgröße: | 1485 px × 1940 px |
| Modell-Rechte: | nicht erforderlich |
| Eigentums-Rechte: | nicht erforderlich |
| Restrictions: |
|
Preise für dieses Bild ab 15 €
Universitäten & Organisationen
(Informationsmaterial Digital, Informationsmaterial Print, Lehrmaterial Digital etc.)
ab 15 €
Redaktionell
(Bücher, Bücher: Sach- und Fachliteratur, Digitale Medien (redaktionell) etc.)
ab 30 €
Werbung
(Anzeigen, Aussenwerbung, Digitale Medien, Fernsehwerbung, Karten, Werbemittel, Zeitschriften etc.)
ab 55 €
Handelsprodukte
(bedruckte Textilie, Kalender, Postkarte, Grußkarte, Verpackung etc.)
ab 75 €
Pauschalpreise
Rechtepakete für die unbeschränkte Bildnutzung in Print oder Online
ab 495 €
