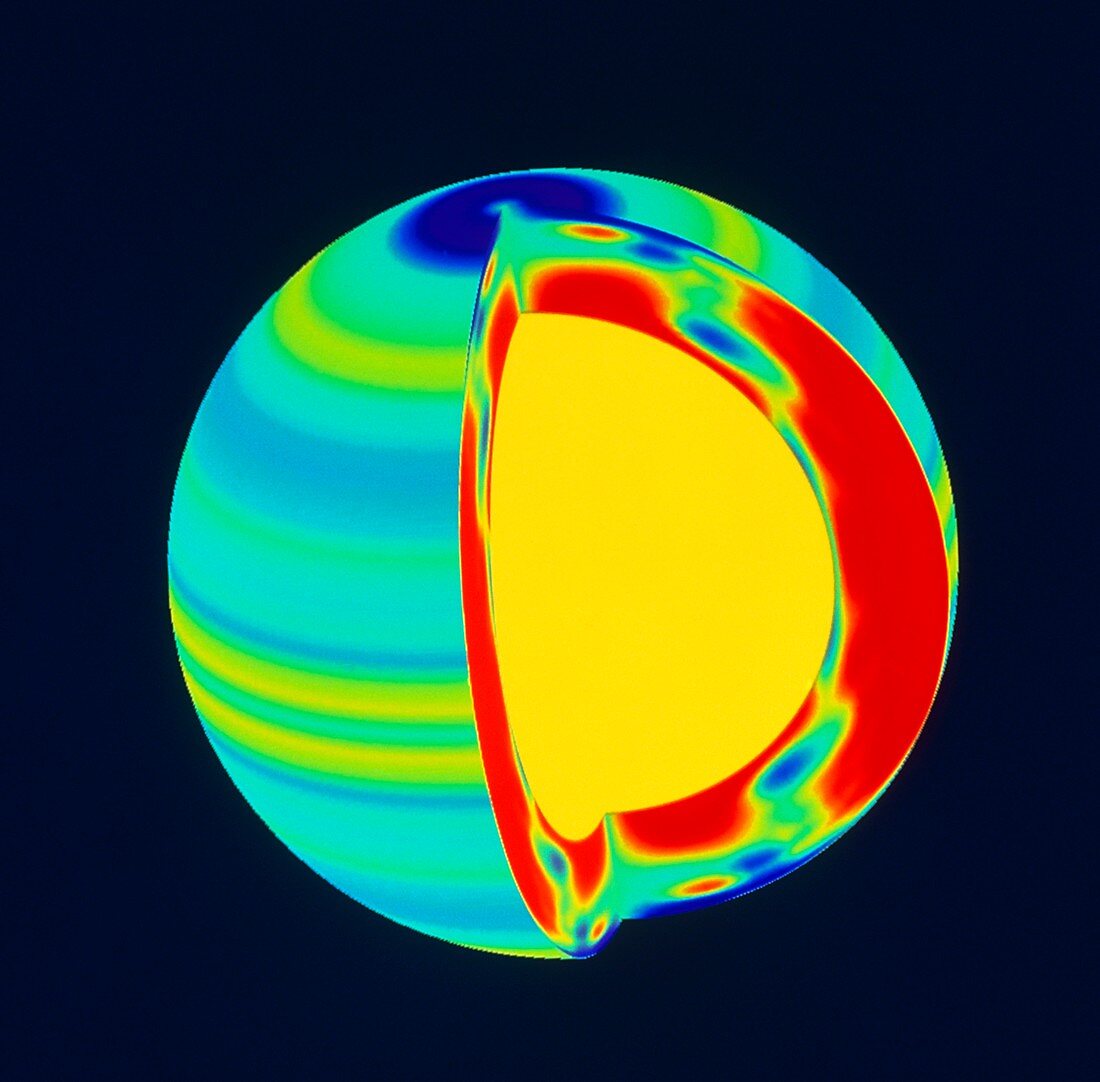
SOHO image of solar (Sun) rotation rate with depth
Bildnummer 11884060

| Solar rotation. Cutaway artwork of the Sun,showing the difference in speeds between different areas of the Sun,based on data from the Solar Heliospheric Observatory (SOHO) satellite. The image is colour-coded to represent rotation speed,with red and yellow being faster than average,green areas average and blue areas slower than average. Zones of hot,electrically-charged gas (plasma) travelling at different speeds give the sun's surface a banded appearance. Sunspots tend to appear at the edge of these bands,possibly because the plasma speed variations in these zones disrupts the local magnetic field. Data taken by SOHO's Michelson Doppler Imager (MDI) instrument | |
| Lizenzart: | Lizenzpflichtig |
| Credit: | Science Photo Library / NASA |
| Bildgröße: | 4252 px × 4181 px |
| Modell-Rechte: | nicht erforderlich |
| Eigentums-Rechte: | nicht erforderlich |
| Restrictions: | - |
Preise für dieses Bild ab 15 €
Universitäten & Organisationen
(Informationsmaterial Digital, Informationsmaterial Print, Lehrmaterial Digital etc.)
ab 15 €
Redaktionell
(Bücher, Bücher: Sach- und Fachliteratur, Digitale Medien (redaktionell) etc.)
ab 30 €
Werbung
(Anzeigen, Aussenwerbung, Digitale Medien, Fernsehwerbung, Karten, Werbemittel, Zeitschriften etc.)
ab 55 €
Handelsprodukte
(bedruckte Textilie, Kalender, Postkarte, Grußkarte, Verpackung etc.)
ab 75 €
Pauschalpreise
Rechtepakete für die unbeschränkte Bildnutzung in Print oder Online
ab 495 €
