Global chlorophyll levels,1998-2010
Bildnummer 11696031
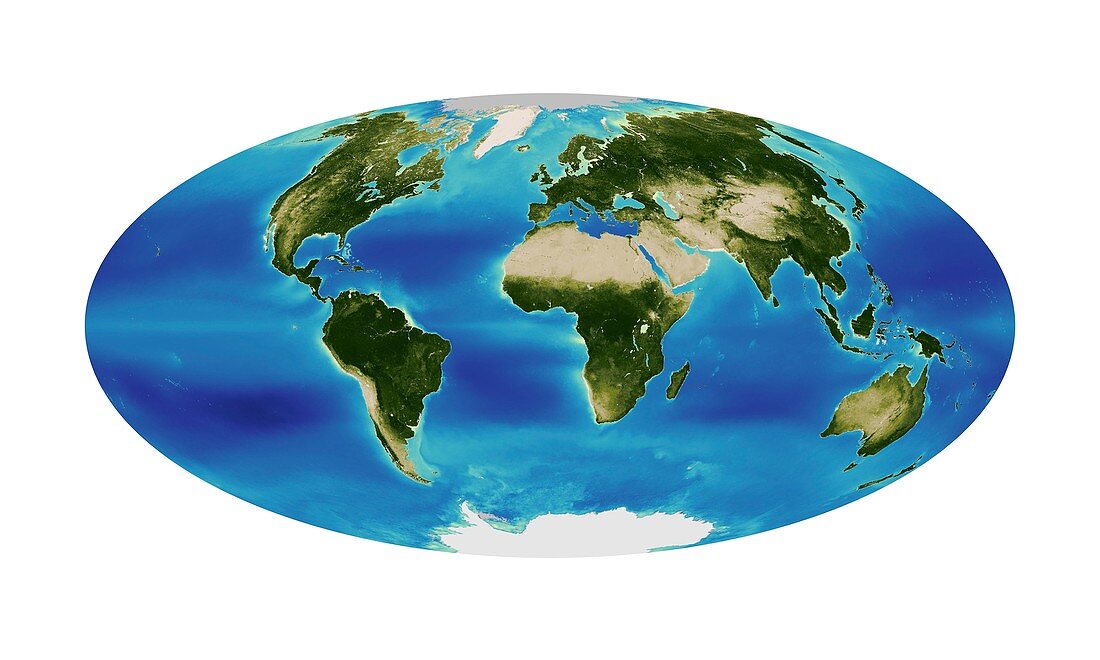
| Global chlorophyll levels,1998-2010. Global satellite map showing chlorophyll levels in the oceans and vegetation density on land,during the period from 1998 to 2010. The ocean colours show concentration of chlorophyll (due to phytoplankton blooms) in milligrams per cubic metre,from low levels (dark blue,0.01) to high levels (light green,64). The vegetation (Normalized Difference Vegetation Index,NDVI) ranges from 0 (white-grey) to 0.9 (dark green). The chlorophyll data was obtained by the Sea-viewing Wide Field-of-view-Sensor (SeaWiFS) on the OrbView-2 spacecraft. SeaWiFS was also able to measure the colours for land vegetation | |
| Lizenzart: | Lizenzpflichtig |
| Credit: | Science Photo Library / GeoEye / Ocean Color Web / NASA EARTH OBSERVATORY |
| Bildgröße: | 3819 px × 2291 px |
| Modell-Rechte: | nicht erforderlich |
| Eigentums-Rechte: | nicht erforderlich |
| Restrictions: | - |
Preise für dieses Bild ab 15 €
Universitäten & Organisationen
(Informationsmaterial Digital, Informationsmaterial Print, Lehrmaterial Digital etc.)
ab 15 €
Redaktionell
(Bücher, Bücher: Sach- und Fachliteratur, Digitale Medien (redaktionell) etc.)
ab 30 €
Werbung
(Anzeigen, Aussenwerbung, Digitale Medien, Fernsehwerbung, Karten, Werbemittel, Zeitschriften etc.)
ab 55 €
Handelsprodukte
(bedruckte Textilie, Kalender, Postkarte, Grußkarte, Verpackung etc.)
ab 75 €
Pauschalpreise
Rechtepakete für die unbeschränkte Bildnutzung in Print oder Online
ab 495 €
Keywords
- 1900er Jahre,
- 1990er Jahre,
- 20. Jahrhundert,
- 2000er Jahre,
- 2010,
- 21. Jahrhundert,
- Algen,
- ausgeschnitten,
- Ausschnitte,
- Biologie,
- biologisch,
- Botanik,
- botanisch,
- Chlorophyll,
- Erdbeobachtung,
- Erde,
- Erdkunde,
- farbcodiert,
- Flora,
- Geographie,
- Gras,
- Karte,
- Land,
- Marine,
- Meer,
- Natur,
- NDVI,
- Niemand,
- Ökologie,
- Ökologisch,
- OrbView-2,
- Ozean,
- Phytoplankton,
- Planet,
- planetarisch,
- Projektion,
- Satellit,
- Satellitenbild,
- Umwelt,
- Vegetation,
- Wälder,
- weißer Hintergrund,
- Weltall,
- weltweit