Global chlorophyll levels,September 2014
Bildnummer 11696014
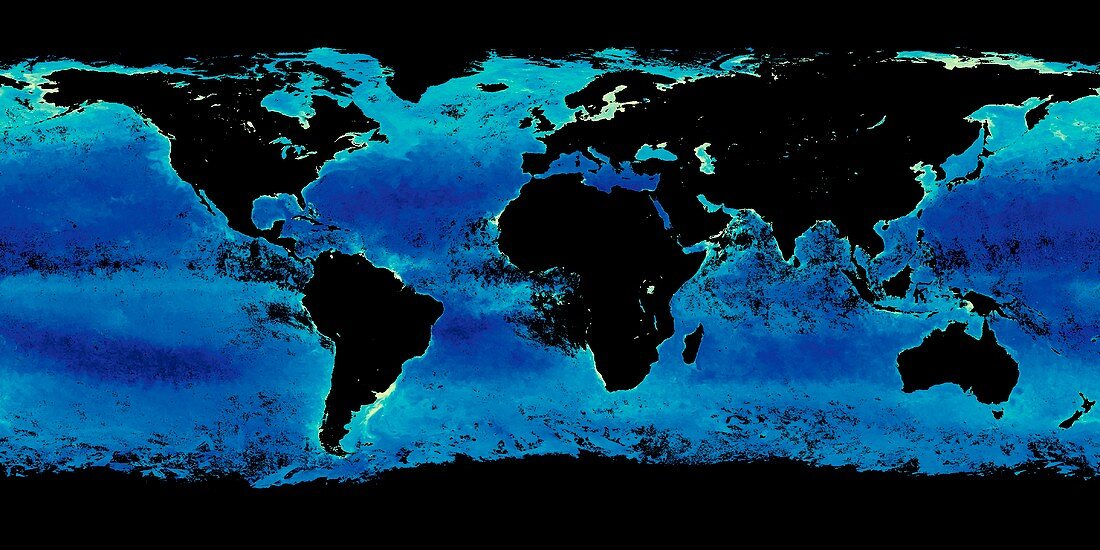
| Global chlorophyll levels,September 2014. Global satellite map showing average chlorophyll levels in the Earth's oceans during the month of September 2014. The ocean colours show concentration of chlorophyll (due to phytoplankton blooms) in milligrams per cubic metre,from low levels (dark blue,0.01) to high levels (light green,30 to 60). Blooms are seen mostly in coastal waters and in the Arctic and Antarctic. The chlorophyll data was obtained by the MODIS (Moderate-resolution Imaging Spectroradiometer) sensor on NASA's Aqua satellite. Black areas show where the satellite could not measure phytoplankton | |
| Lizenzart: | Lizenzpflichtig |
| Credit: | Science Photo Library / NASA Earth Observatory |
| Bildgröße: | 4191 px × 2095 px |
| Modell-Rechte: | nicht erforderlich |
| Eigentums-Rechte: | nicht erforderlich |
| Restrictions: | - |
Preise für dieses Bild ab 15 €
Universitäten & Organisationen
(Informationsmaterial Digital, Informationsmaterial Print, Lehrmaterial Digital etc.)
ab 15 €
Redaktionell
(Bücher, Bücher: Sach- und Fachliteratur, Digitale Medien (redaktionell) etc.)
ab 30 €
Werbung
(Anzeigen, Aussenwerbung, Digitale Medien, Fernsehwerbung, Karten, Werbemittel, Zeitschriften etc.)
ab 55 €
Handelsprodukte
(bedruckte Textilie, Kalender, Postkarte, Grußkarte, Verpackung etc.)
ab 75 €
Pauschalpreise
Rechtepakete für die unbeschränkte Bildnutzung in Print oder Online
ab 495 €
Keywords
- 2014,
- 21. Jahrhundert,
- Algen,
- aqua,
- Biologie,
- biologisch,
- Botanik,
- botanisch,
- Chlorophyll,
- Erdbeobachtung,
- Erde,
- Erdkunde,
- farbcodiert,
- Flora,
- Geographie,
- Karte,
- Küste,
- Küsten-,
- Marine,
- Meer,
- modis,
- Natur,
- Niemand,
- Ökologie,
- Ökologisch,
- Ozean,
- Phytoplankton,
- Planet,
- planetarisch,
- Projektion,
- Satellit,
- Satellitenbild,
- schwarzer Hintergrund,
- Umwelt,
- Vegetation,
- Weltall,
- weltweit