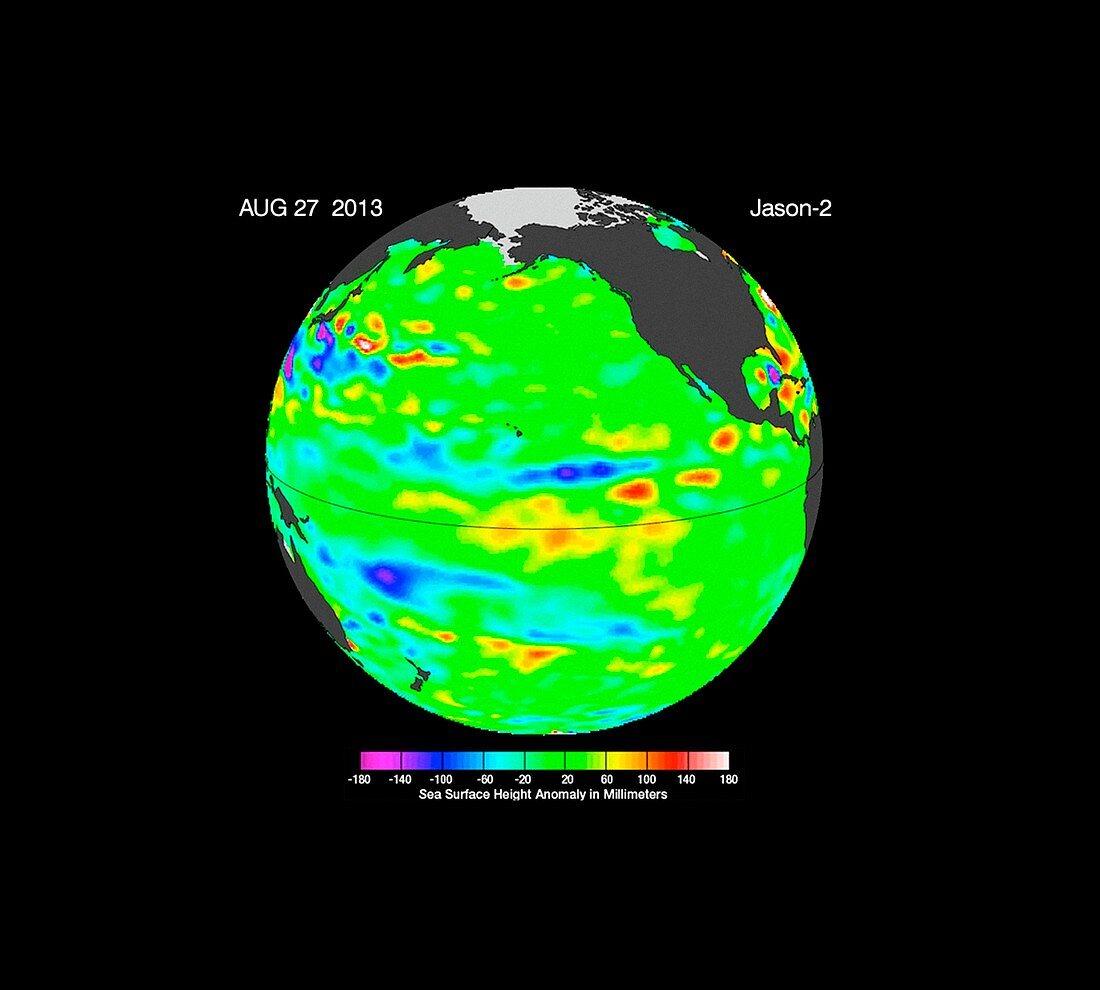
La Nada climate pattern,satellite image
Bildnummer 11692972

| La Nada climate pattern,satellite image. Ocean surface topography image showing the sea surface heights in the Pacific Ocean during the 16th month of being locked in what is sometimes termed a neutral,or 'La Nada' state. La Nadas make long-range climate forecasting more difficult due to their greater unpredictability. Yellows and reds indicate areas where waters are relatively warmer and have expanded above normal sea level,while blues and purple areas show where waters are relatively colder and sea level is lower than normal. The near-normal conditions are shown in green,based on the average of 10 days of data centered on 27th August 2013. Imaged by NASA's Jason-2 satellite | |
| Lizenzart: | Lizenzpflichtig |
| Credit: | Science Photo Library / Ocean Surface Topography Team / Caltech / NASA-JPL |
| Bildgröße: | 1981 px × 1783 px |
| Modell-Rechte: | nicht erforderlich |
| Eigentums-Rechte: | nicht erforderlich |
| Restrictions: | - |
Preise für dieses Bild ab 15 €
Universitäten & Organisationen
(Informationsmaterial Digital, Informationsmaterial Print, Lehrmaterial Digital etc.)
ab 15 €
Redaktionell
(Bücher, Bücher: Sach- und Fachliteratur, Digitale Medien (redaktionell) etc.)
ab 30 €
Werbung
(Anzeigen, Aussenwerbung, Digitale Medien, Fernsehwerbung, Karten, Werbemittel, Zeitschriften etc.)
ab 55 €
Handelsprodukte
(bedruckte Textilie, Kalender, Postkarte, Grußkarte, Verpackung etc.)
ab 75 €
Pauschalpreise
Rechtepakete für die unbeschränkte Bildnutzung in Print oder Online
ab 495 €
Keywords
- Äquator,
- ausgeschnitten,
- Ausschnitte,
- Bedingungen,
- Ebenen,
- Erdbeobachtung,
- farbcodiert,
- geografisch,
- Geographie,
- Globus,
- Höhe,
- jason-2,
- Klimatologie,
- klimatologisch,
- Kondition,
- Neutral,
- Niemand,
- Oberfläche,
- Ozean,
- Pazifik,
- Planet,
- Planetenwissenschaft,
- Satellitenbild,
- schwarzer Hintergrund,
- Sonnensystem,
- Staat,
- topografisch,
- Topographie,
- topographisch,
- Welt,
- Weltall,
- Wetter
