Chlorophyll levels,satellite image
Bildnummer 11550113
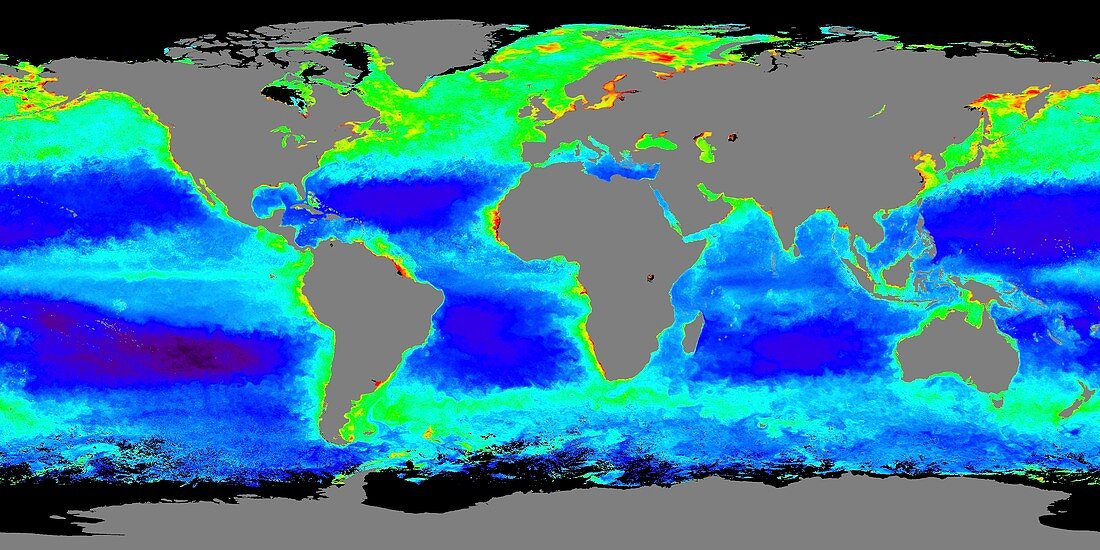
| Chlorophyll levels. Colour-coded satellite image showing the global chlorophyll concentrations between 21st March and 20th June 2006. Levels range from black (low) to red (high),through dark blue,light blue,green,yellow,and orange. Observation of global chlorophyll patterns shows where ocean surface plants (phytoplankton) are growing,and gives an indication of where marine ecosystems are thriving. Maps like this give an idea of how much carbon the plants are soaking up,which is important in understanding the global carbon budget. Image created from data obtained by the Sea-viewing Wide Field-of-view Sensor (SeaWiFS) satellite,and the MODIS instrument on NASA's Aqua satellite | |
| Lizenzart: | Lizenzpflichtig |
| Credit: | Science Photo Library / NASA |
| Bildgröße: | 4320 px × 2160 px |
| Modell-Rechte: | nicht erforderlich |
| Eigentums-Rechte: | nicht erforderlich |
| Restrictions: | - |
Preise für dieses Bild ab 15 €
Universitäten & Organisationen
(Informationsmaterial Digital, Informationsmaterial Print, Lehrmaterial Digital etc.)
ab 15 €
Redaktionell
(Bücher, Bücher: Sach- und Fachliteratur, Digitale Medien (redaktionell) etc.)
ab 30 €
Werbung
(Anzeigen, Aussenwerbung, Digitale Medien, Fernsehwerbung, Karten, Werbemittel, Zeitschriften etc.)
ab 55 €
Handelsprodukte
(bedruckte Textilie, Kalender, Postkarte, Grußkarte, Verpackung etc.)
ab 75 €
Pauschalpreise
Rechtepakete für die unbeschränkte Bildnutzung in Print oder Online
ab 495 €
Keywords
- 21. Jahrhundert,
- absorbierend,
- Absorption,
- Biologie,
- biologisch,
- Botanik,
- botanisch,
- Chlorophyll,
- Ebenen,
- Erdbeobachtung,
- Erde,
- farbcodiert,
- Flora,
- Forschung,
- Frühling,
- Globale Erwärmung,
- Karte,
- Klimatologie,
- klimatologisch,
- Klimawandel,
- Kohlendioxid,
- Kohlenstoff,
- Kontinent,
- Kontinente,
- Konzentration,
- Konzentrationen,
- Meer,
- Messung,
- modis,
- Muster,
- NASA,
- Natur,
- Ozean,
- Ozeane,
- ozeanisch,
- Pflanze,
- Pflanzen,
- Phytoplankton,
- planetarisch,
- Plankton,
- Reichweite,
- Satellit,
- Satellitenbild,
- Sommer,
- Wachsen,
- wachsend,
- Wachstum,
- Welt,
- weltweit